One of the most intriguing applications of web scraping is getting inventory data from the target websites. It’s like looking through the keyhole in a warehouse and being able to discover secrets about your competitors, in a whole new and powerful way.
Why inventory data is a gamechanger
Imagine you’re the owner of a multi-brand clothing store. You’re selling hundreds of items from different brands, some of them are performing well, others less. Let’s say you’re also 10 years ahead of your competitors in your city, and you’ve got already a pricing monitoring tool that allows you to offer the best prices in town. How do you benchmark your performances with your peers? How do you know if your competitor B, who bought the same sweater you can’t sell, but in another color, is having the same difficulties?
Or imagine you’re a fast fashion brand: how important would be to know the top seller products in a certain geography, so you can take inspiration and go out the market with your own items, following a trend that is just starting?
These are two examples in the fashion industry. Still, they could be translated into many other industries, and make us understand how impactful this kind of data could be for a business.
How we can scrape inventory data
The first requirement for scraping inventory data is that this is used somewhere on the website, and we’ll see later some usual patterns to discover it.
The second requirement is that you don’t have to interfere with the business of the website by collecting it or its terms of service.
Let’s say a website shows this information only when adding items to your cart and this operation is allowed only after a login, you need to read carefully its Terms of Services to understand if you’re breaking any rule.
After checking these points, we can start thinking about our data products and their technical realization. Starting from our industry expertise, we should start analyzing the specific case for the target website and understand what’s the best solution to implement.
What’s the best frequency for scraping?
Are we operating in the grocery industry or the automotive? Depending on the frequency of people buying a product, we can choose the scraping heartbeat. While scraping once a day a car dealer’s website is enough to see how many cars have been sold in the past 24 hours, when talking about groceries this could not be enough. There are intraday refurbishments of products, probably more than one, and without a more frequent scraper we could miss the real number of sales.
The more frequent the scraping is, the more accurate the estimate of the sales on that website will be, but on the other hand, it will be also more expensive.
The key is to find the right balance between budget and the accuracy of your estimates.
What’s the meaning of the number we’re seeing?
It’s not always easy to find the inventory data, if available, on a target website.
In some cases, it’s clearly identifiable in the code and directly corresponds with what’s available to buy on the website.
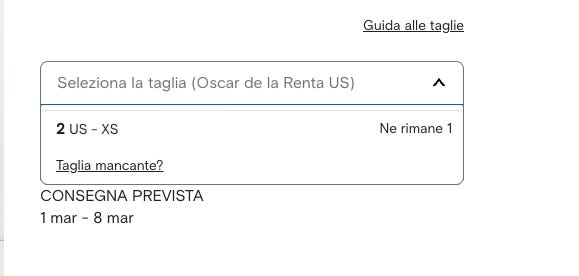
Let’s take as an example this fashion website, where we have only one item left for the size XS.
[

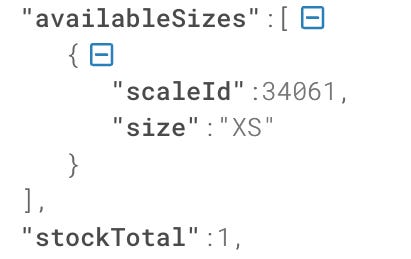
If we dig in the internal APIs, there’s a perfect match, since it’s written that only one item of the size XS is available.
[
As we’ve seen in “The Lab 28” article instead, when scraping Lowe’s website, if we choose to pick up our fridge in a store, what we see in the internal API is not the stock of the single store but probably the ones of a central warehouse who serves multiple stores.
The numbers were too big for a single store, with hundreds of millions of USD of stock value only for a certain type of fridge.
In some other cases, we get values strictly related to the day-to-day operations of the business we have to interpret.
[

What’s the meaning of area? and about RetailArea? That’s something we need to understand by studying how the websites behave when the same product is selected in different locations.
Main challenges
Extracting value from inventory data is more challenging than other web scraping applications, like price monitoring.
There are three main aspects to consider when starting a stock tracking project:
-
it takes time: depending on the industry, you need at least months if not years of successful stock scraping to be able to extract some value from the data. If you’re willing to create a dataset for financial investors, probably two years are the minimum history, since you need to understand how the data changes year over year. In other use cases, like competitor benchmarking, you need probably fewer months.
-
consistency between website regions: websites sometimes don’t behave consistently between different regions. The target could have a different website in China rather than Europe, making homogeneous data collection in multiple countries difficult if not impossible.
-
you need a layer of abstraction on top of your data: collecting the product inventory daily is great but probably enough. You need to apply some rules, deducted from your business expertise, to estimate the sales during the monitored time.
Where you can find inventory data
In the rest of the article, available for paying readers, we’ll see some common places where to look, to find inventory data.
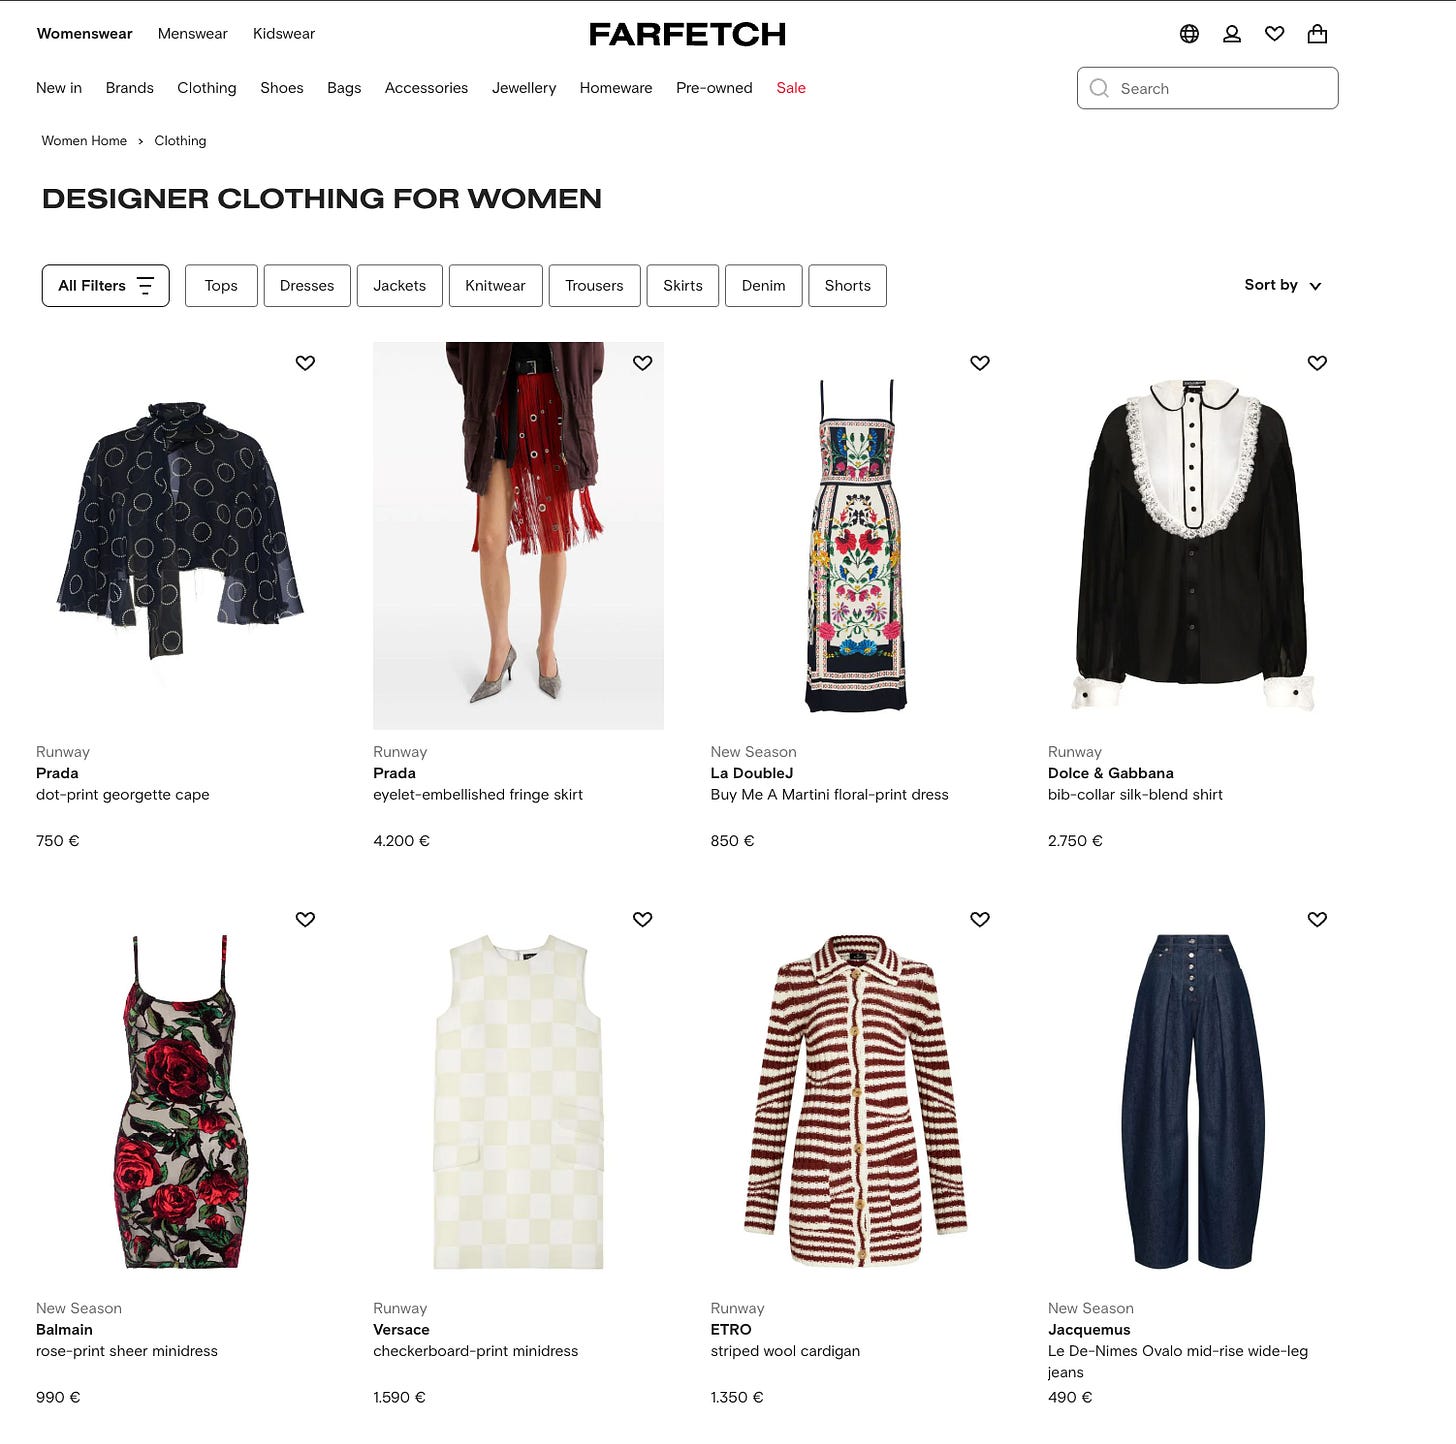
Example 1: the product List page
This is the ideal place where to find the inventory data, but unluckily it’s one of the less common.
[
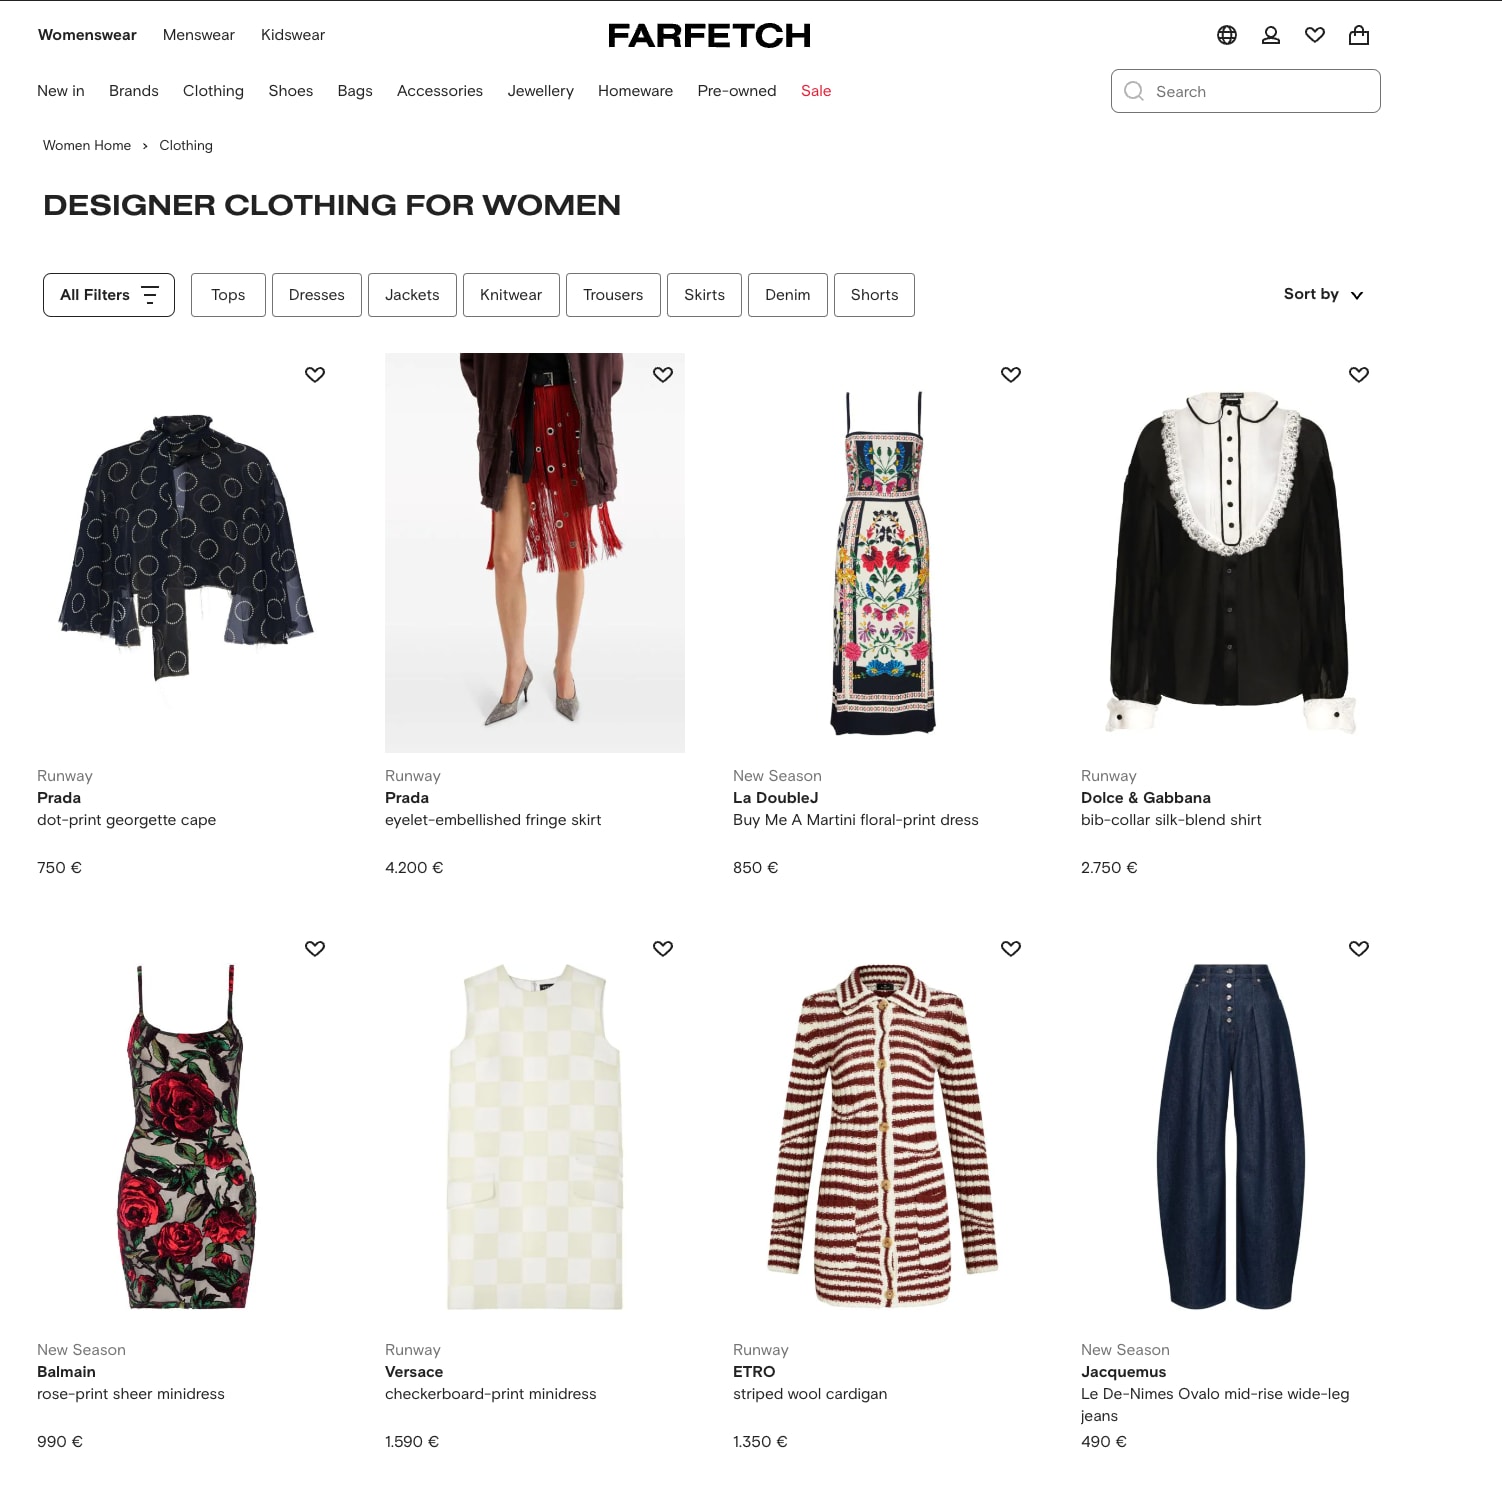
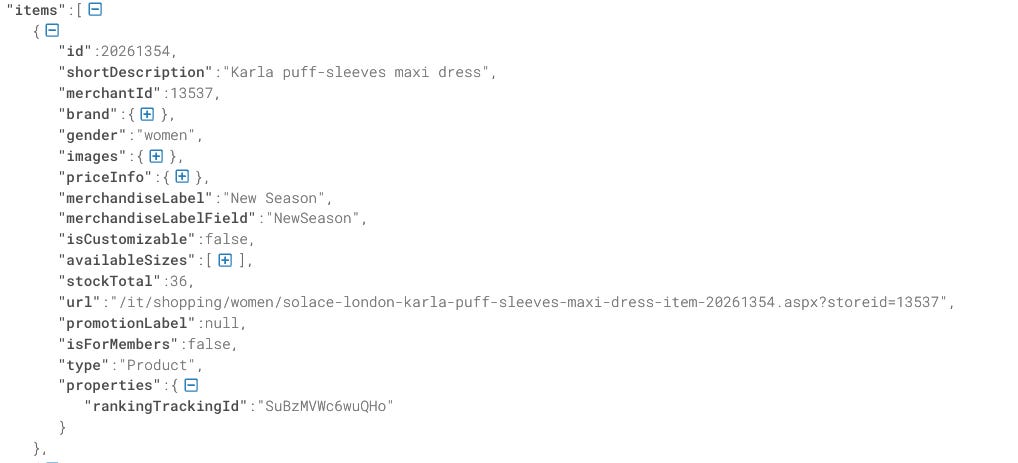
In the case of Farfetch.com, when entering a product list page, we have this luck, both if we query the HTML or the internal APIs, by monitoring the XHR calls.
[

You can see from the JSON that we have the stockTotal field, which is the sum of the stock of every single size of the product. How do I know it? We’re seeing it now.
Example 2: the product detail page
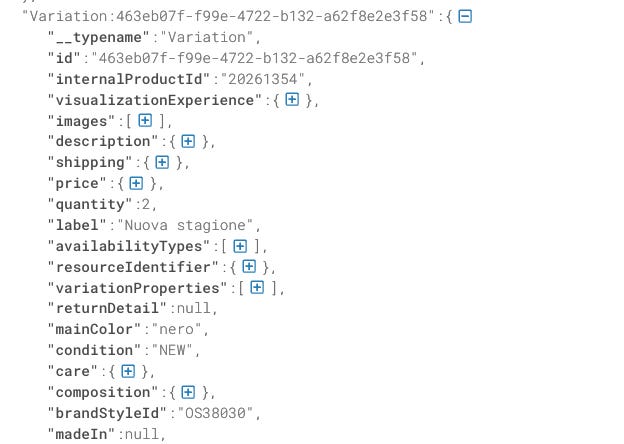
The nice fact about the Farfetch website, but it’s not the only one, is that in the HTML of the product detail page, there’s a long JSON, not easily readable, but full of useful information like the stock per each size.
[
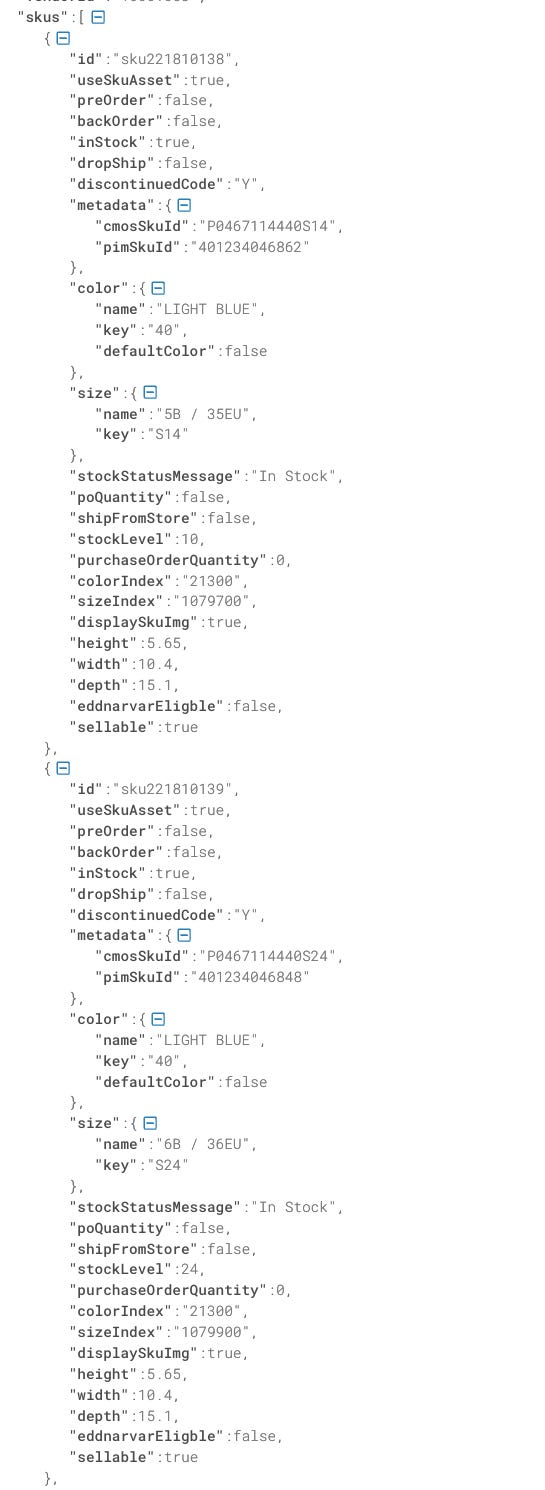
The same happens for the Neiman Marcus website, when on the detail page, per every size and color, we have a JSON with stockLevel values.
[

Example 3: collect in store
One common case where stock can be scraped from websites is when they allow the collection of items directly in a physical store.
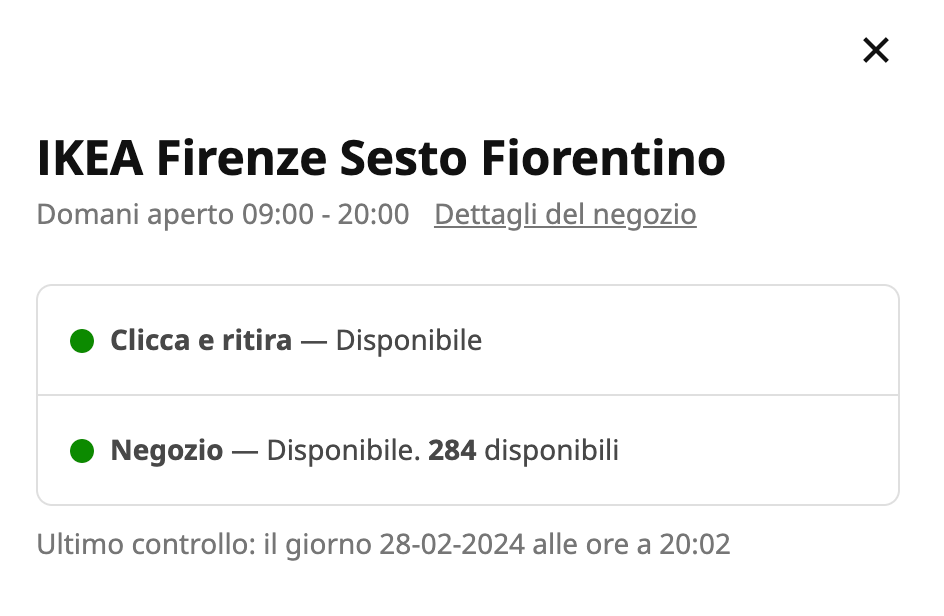
We’ve already seen this case with Lowe’s and with Ikea in our previous posts. The interesting thing is that, in the Ikea case, the inventory data is clear and visible clearly.
[

While for Lowe’s or other websites, we need to investigate the internal APIs, if any, when we select a pickup store.
Let’s see another website, like Burberry.com. If we go to the product detail page, we can select a country and click on “Find in store”.
[
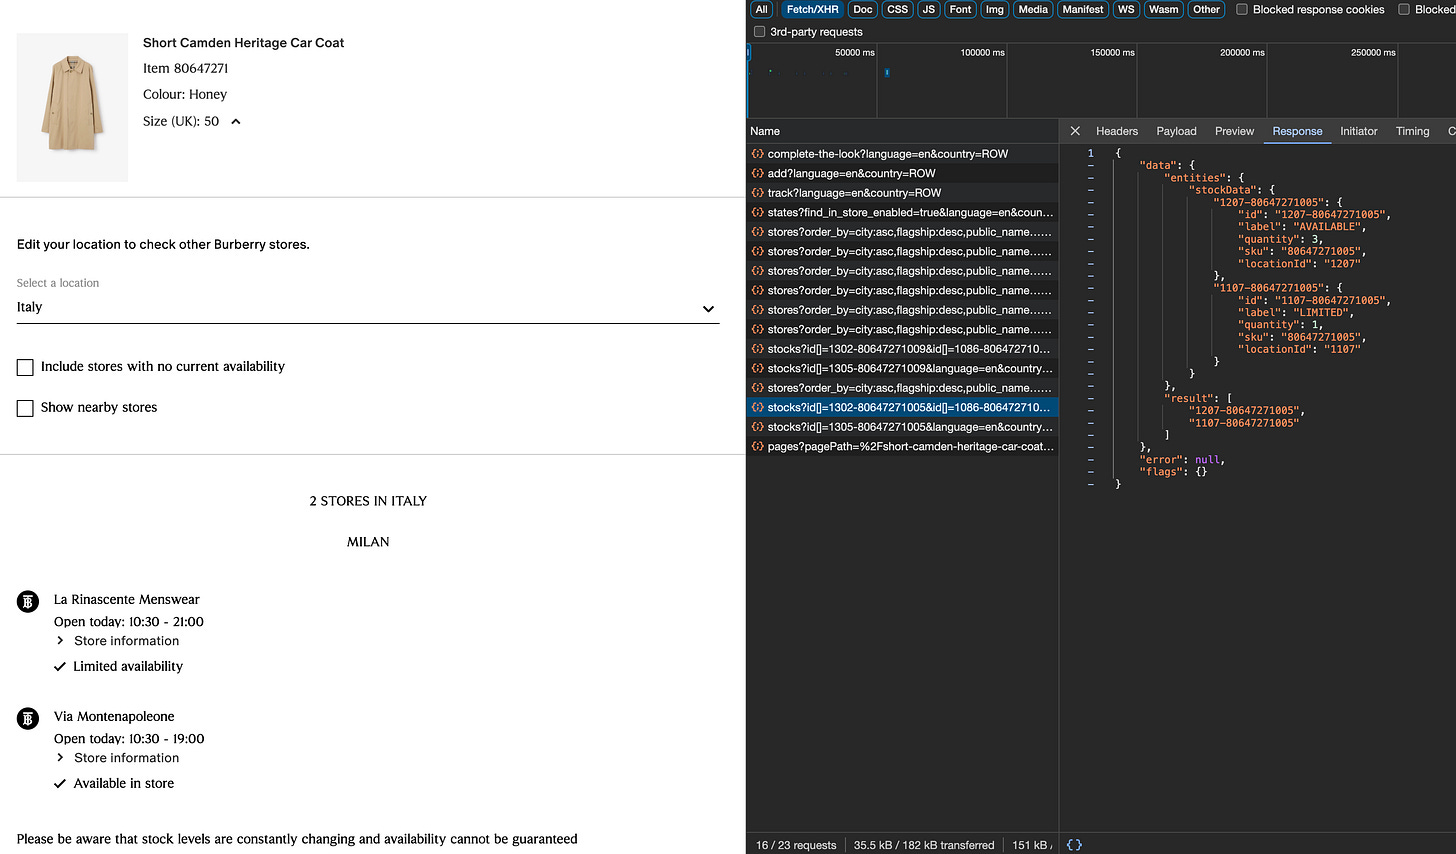
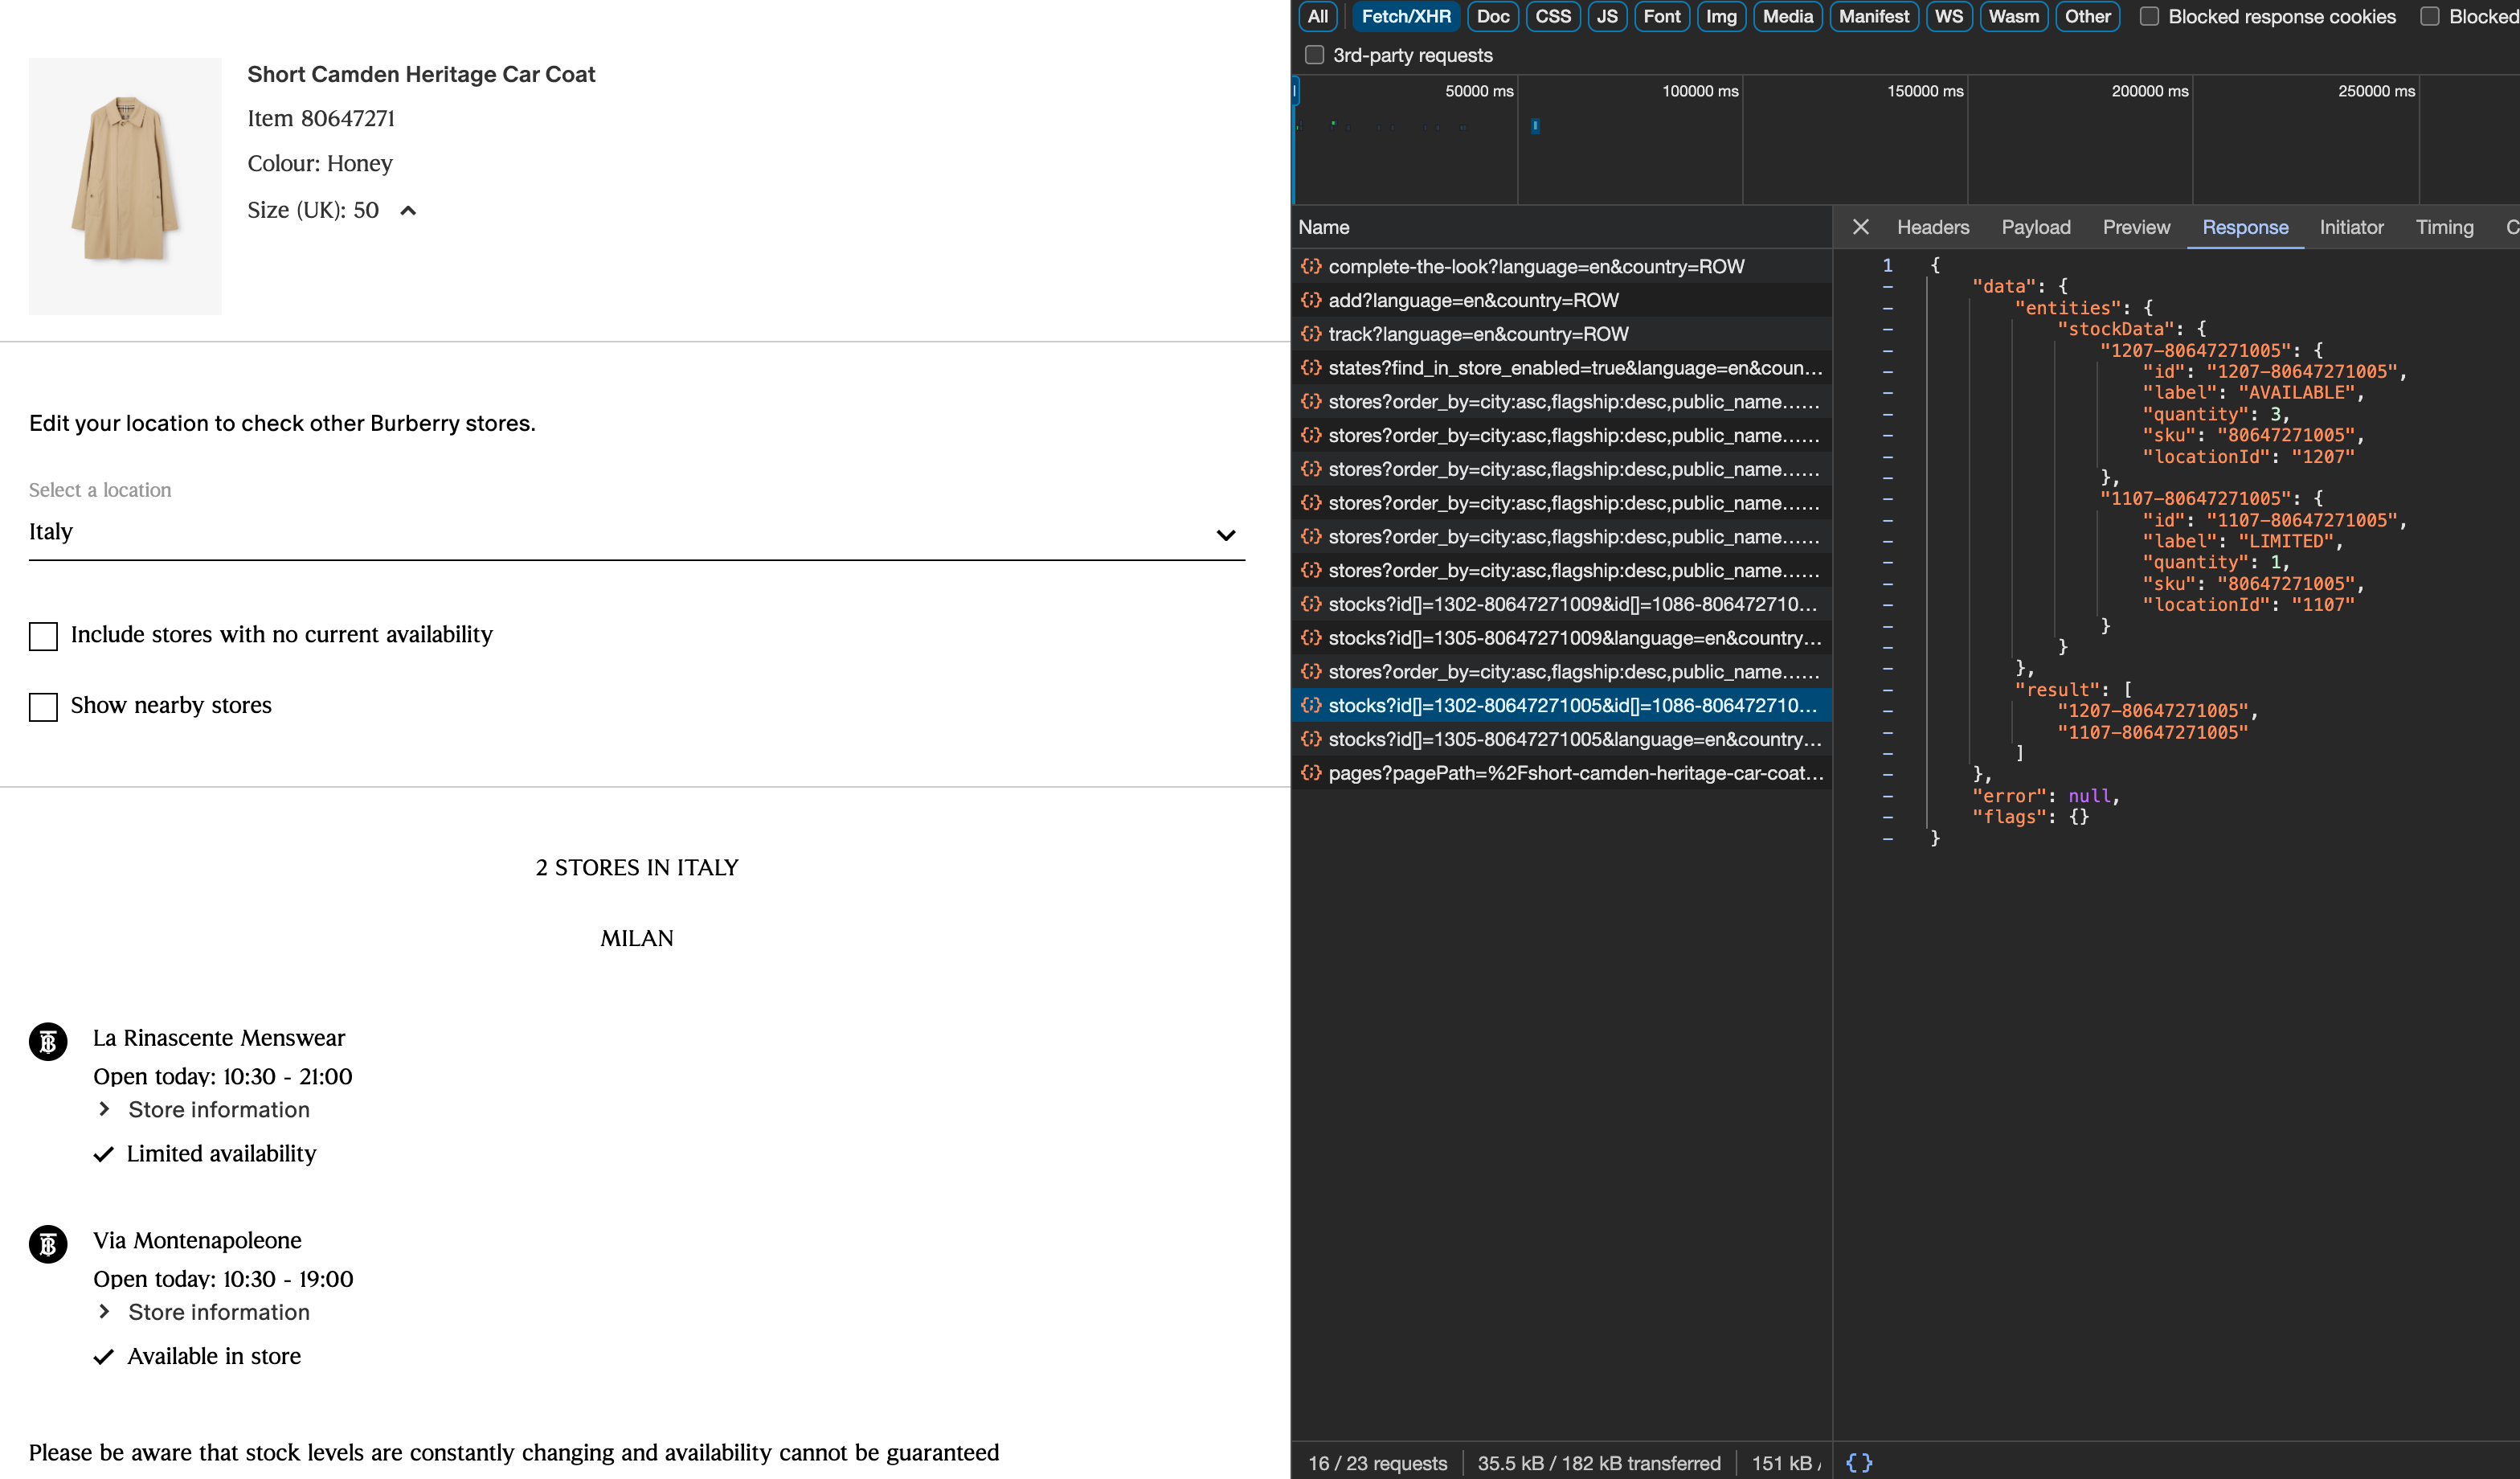
By inspecting the internal APIs, we can not only see the stores where the item is available but even the quantity of items available.
Considering that Burberry has hundreds of stores all over the world and thousands of items on sale, and also that this API needs to be called for each size of these products, you can understand that a simple global snapshot is made by millions of API calls.
While providing a huge amount of value, this data is extremely expensive to collect, but you can understand this is a pure gold gem hidden in the website.
Example 4: Add to cart button
This is the most difficult case: for each item on the website, you need to add it to the shopping cart and increase the number of items you’re willing to purchase until the website or the internal APIs tell you how many items are in stock.
[
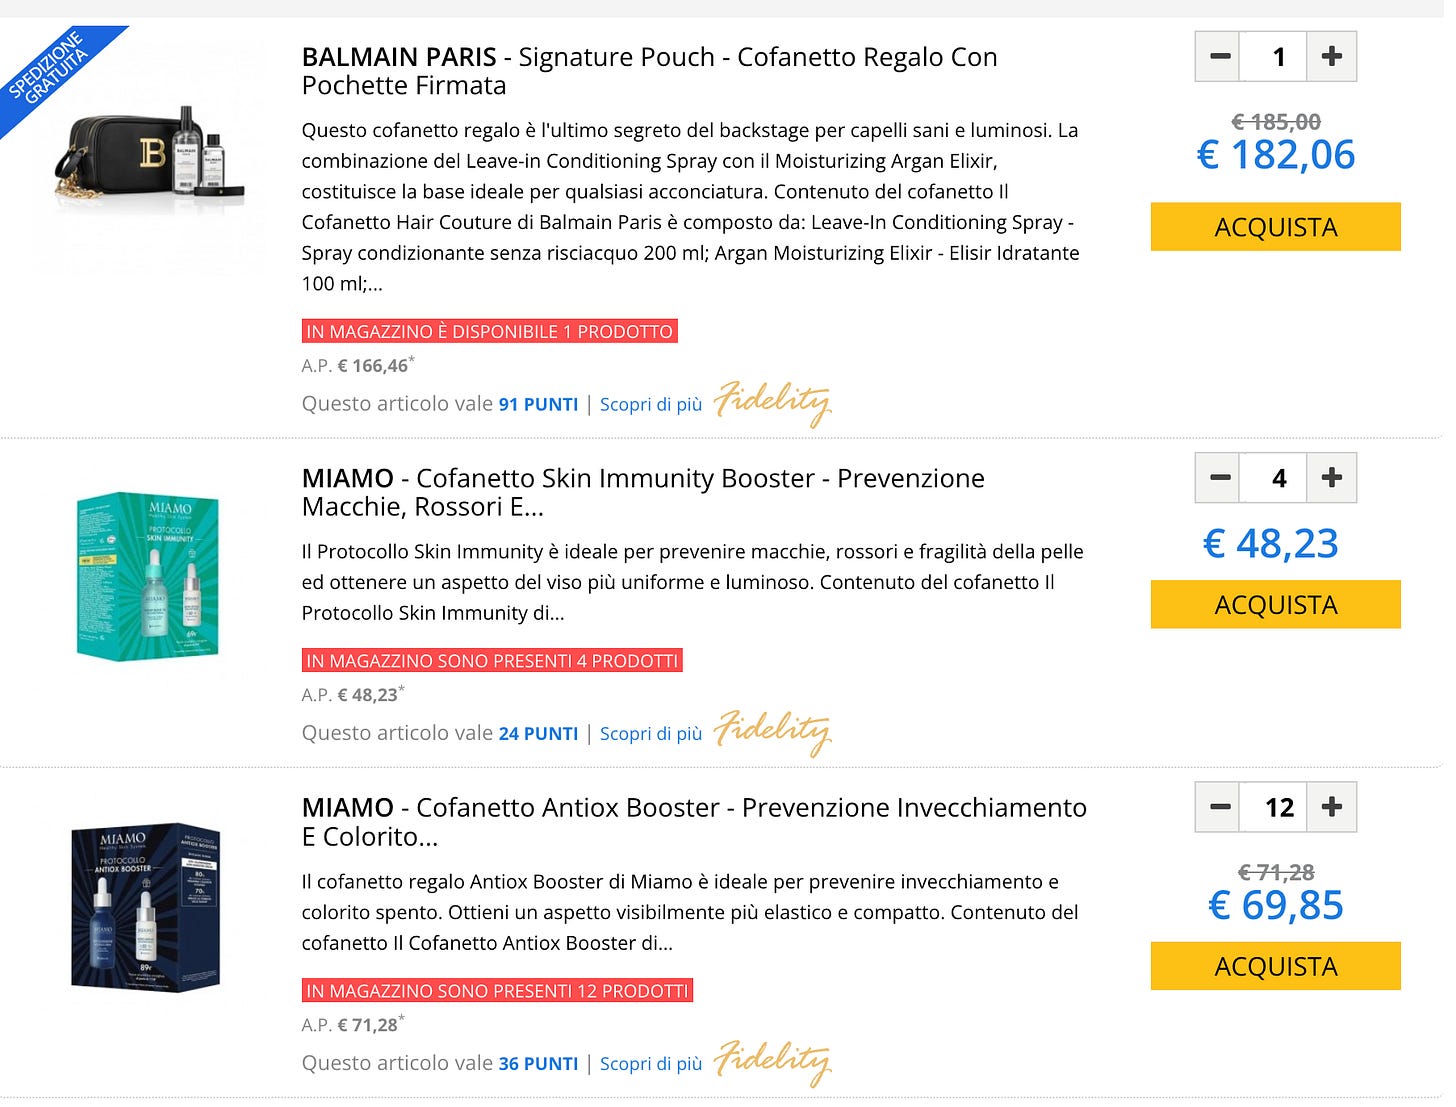
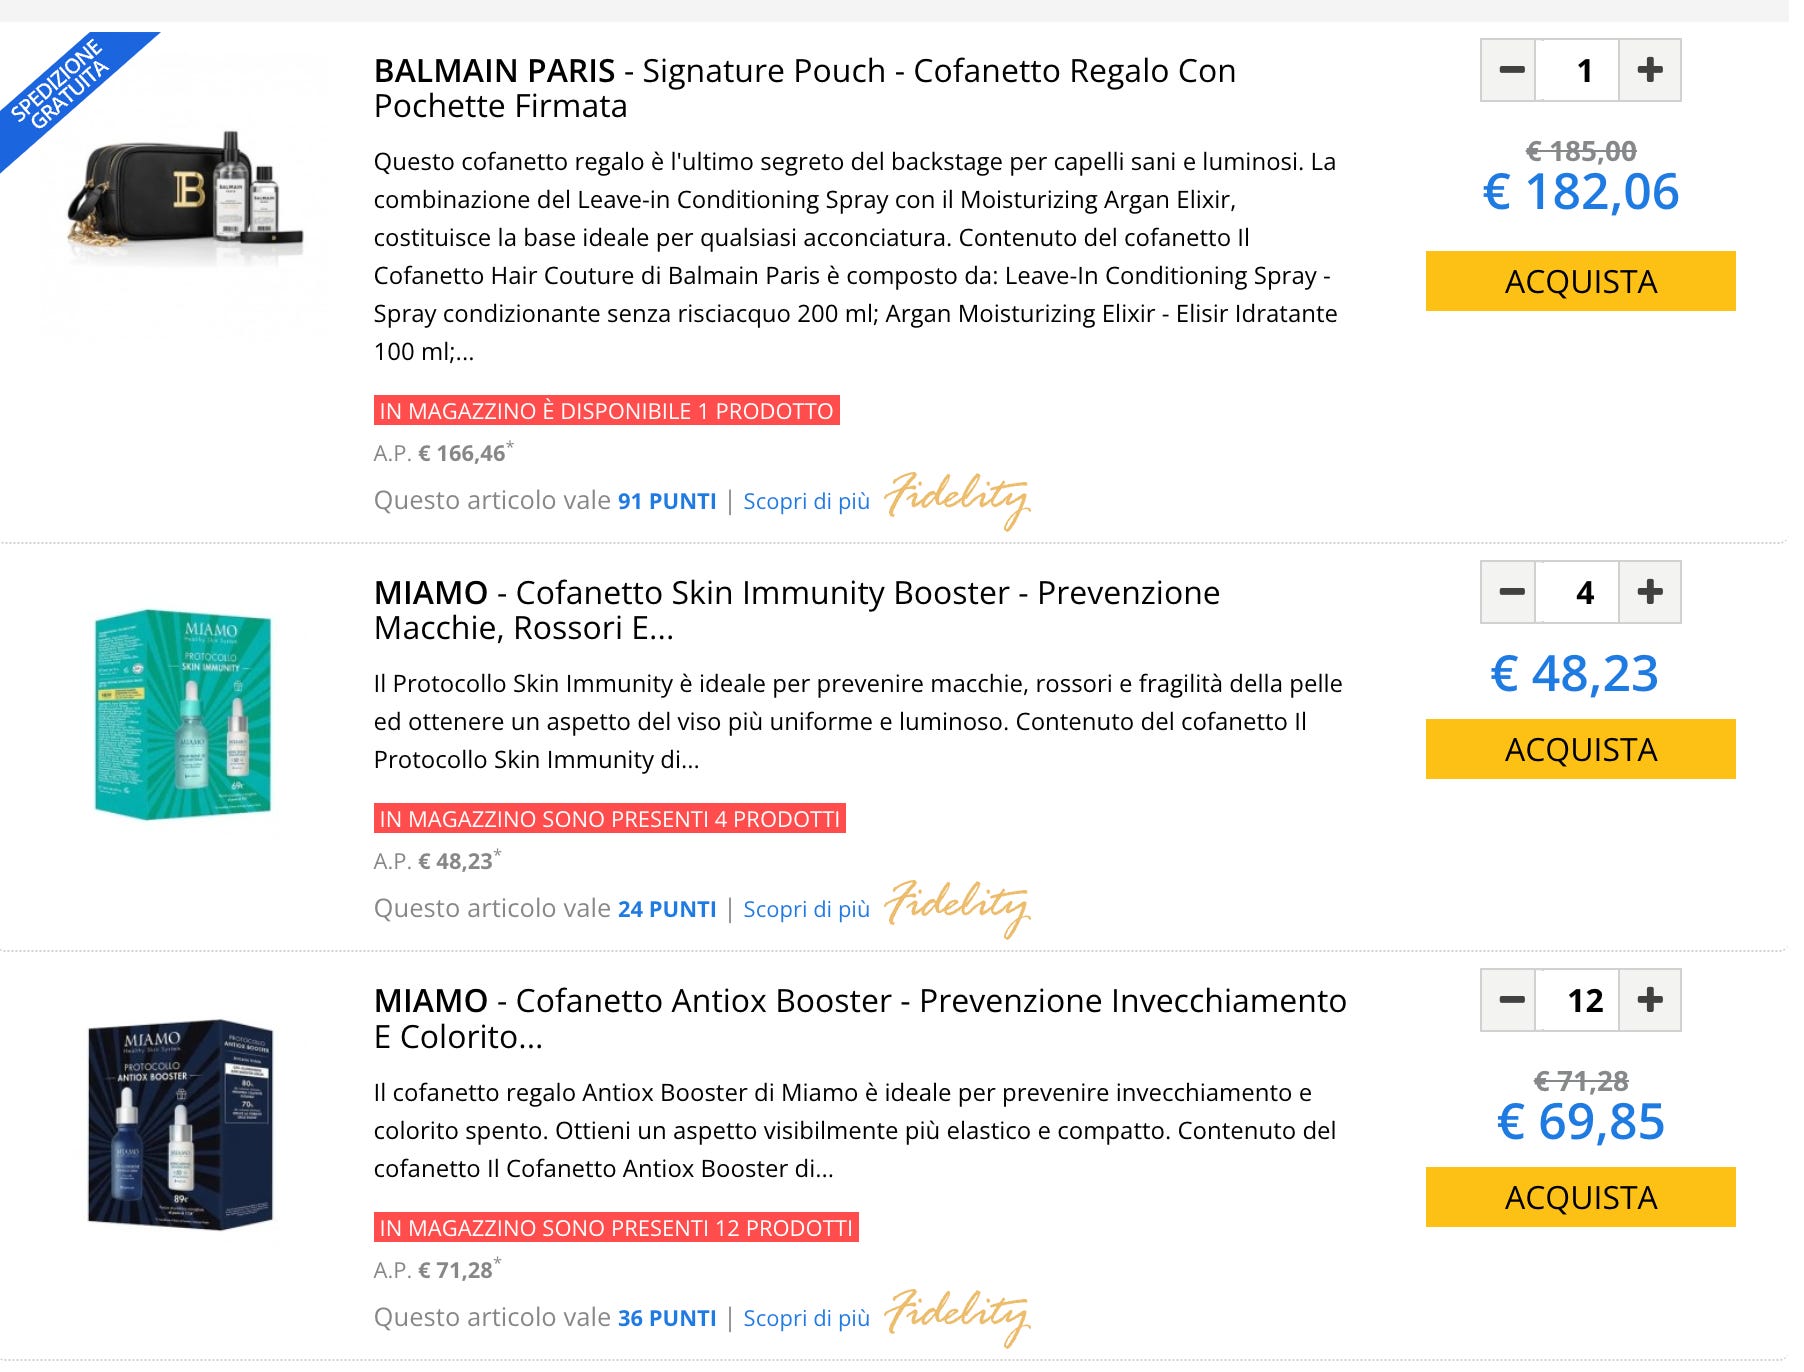
This is the most compute-intensive method and should be used as a last resort since the number of requests to make on an average-sized website is huge and we must be sure also that the target website could handle them.
Final remarks on scraping inventory data
In this episode of The Lab, we’ve made a deep dive into scraping inventory data, which is a great opportunity for businesses and investors to extract value and insight from web data.
There’s literally a gold mine hidden in many websites, ready to be collected from scraping professionals. Of course, this has a cost: in many cases, we need millions of requests for a full snapshot, and we need at least some months of history to achieve some results.
On Databoutique we just started publishing the first datasets about inventory, in case you’re interested in these insights but don’t want to feel the pain of the data extraction, you can have a look at this page.