THE LAB #8: Using Bezier curves for human-like mouse movements
Excerpt
What are Bezier curves and why are important in web scraping?
Here’s another post of “THE LAB”: in this series, we’ll cover real-world use cases, with code and an explanation of the methodology used.
Being a paying user gives:
-
Access to Paid Content, like the post series called “The LAB”, where we’ll go deep diving with code real-world cases (view here an example).
-
Access to the GitHub repository with the code seen on ‘The LAB”
-
Access to private channels on our Discord server
But in case you want to read this newsletter for free, you will always get a post per week about:
-
News about web scraping
-
Anti-bot software and techniques insights
-
Interviews with key people in the industry
And you can always join the Web Scraping Club Discord server
Enough housekeeping, for now, let’s start.
What is a Bezier curve?
In computer graphics, connecting point A to point B, we use lines that can be categorized as straight or curved. The first ones are easily implemented in software, while the second, while easy to draw for humans, are much more difficult for computers.
In 1962 a French engineer working for Renault called Pierre Bezier published his studies about drawing curves well-suited for design work, using mathematical functions.
The Bezier curves are parametric curves where you define a set of control points, that determine its shape and curvature and interpolate the points in between the results.
A much more detailed explanation can be found at this link, where you can deep dive into all the mathematics aspects.
Why Bezier curves are interesting for web scraping?
As said before, Bezier curves create smooth curves for going to point A to point B, when applied to mouse movement. While a native move function on Playwright will use a straight line for going from A to B, using a Bezier curve trajectory will make the movement seem more human-like. Of course, this comes to be interesting for web scraping when we’re facing anti-bot solutions that track the user behavior to detect anomalies: reproducing a more human-like mouse movement should trigger fewer red flags.
Implementation
Warning: this paragraph will contain some math!
As we noted before, what we need to implement a Bezier curve is:
-
A set of control points, the curve will pass from some of them and others will set other parameters.
-
The ratio R that represents the density of the interpolation. From 0 to 1, a ratio of 0.1 means that there will be 10 points t between the start and the end of the curve, each at the same distance. With a ratio of 0.5, there will be only 1 point t in between.
Given the following formulas for the various types of Bezier curves
[

Bezier curves
we’ll see how to implement a cubic one, that requires 4 control points.
Setting the control points and ratio
I’ve chosen the following four control points. The first and the last are the start and the stop of the curve, so basically, we’ll have a curve that will be like a semi-circle but, given the coordinates of the second and the third point, will likely be more angled on the first half and smoother on the second one.
<code>control_points = [[200, 200], [230, 400], [280, 300], [300, 200]]
</code>
Since I’d like to see the curve drawn on the monitor, I’d like to see many points belonging to it.
Using the following command from NumPy package, we’re basically setting 100 points between 0 and 1
<code>t = np.linspace(0, 1, 100)
</code>
This means that every point is distanced of 0.01 and so we get an array of 100 values like the following:
[0.01, 0.02, 0.03] and so on.
Calculating the intermediate points
Using the cubic formula, now we’re gonna calculate the coordinates for every point of the curve.
For the X coordinates, we’ll use the X of the 4 control points, while t is the value from the interval array calculated before.
So given the generic formula the formula, the 4 control points set up before, and the t=0.01 for the first point, we’ll translate the following
[

into
[

and it equals 200.897.
Same for Y where
[

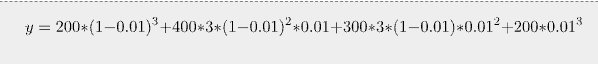
equals 205.918.
Repeating this for every interval t, will give us the list of the points of the curve.
[

Bezier curves formula
Drawing curves
Just to have a look at the different mouse movements we’ll make a playwright program that implements both the standard mouse movement and the Bezier curve movement. We’ll make it draw the curves on an online version of Paint, just to show the difference between the 2 approaches.
<code>def straight_mouse_movement(page):
rand1=randrange(50,200)
rand2=randrange(50,200)
page.mouse.move(rand1, rand2)
page.mouse.down()
rand1=randrange(50,200)
rand2=randrange(50,200)
page.mouse.move(rand1, rand2)
page.mouse.up()
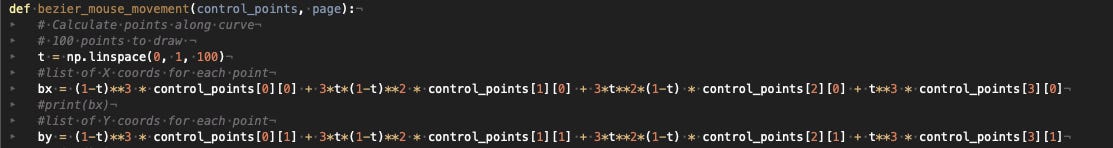
def bezier_mouse_movement(control_points, page):
# Calculate points along curve
# 100 points to draw
t = np.linspace(0, 1, 100)
#list of X coords for each point
bx = (1-t)**3 * control_points[0][0] + 3*t*(1-t)**2 * control_points[1][0] + 3*t**2*(1-t) * control_points[2][0] + t**3 * control_points[3][0]
#print(bx)
#list of Y coords for each point
by = (1-t)**3 * control_points[0][1] + 3*t*(1-t)**2 * control_points[1][1] + 3*t**2*(1-t) * control_points[2][1] + t**3 * control_points[3][1]
#print(by)
# Create HumanClicker instance
clicker = HumanClicker()
for i in range(len(bx)):
page.mouse.move(bx[i], by[i])
page.mouse.down()
page.mouse.up()
with sync_playwright() as p:
browser = p.firefox.launch(headless=False, slow_mo=300)
#browser = p.chromium.launch_persistent_context(user_data_dir='./userdata/', channel="chrome", headless=False,slow_mo=200, args=CHROMIUM_ARGS)
#ua=random.choice(USERAGENT_LIST)
page = browser.new_page()
#stealth_sync(page)
page.goto('<https://jspaint.app/#local:819c4295e19f3>', timeout=0)
#page.wait_for_load_state("load")
interval=randrange(10)
time.sleep(interval)
straight_mouse_movement(page)
time.sleep(3)
control_points = [[200, 200], [230, 400], [280, 300], [300, 200]]
bezier_mouse_movement(control_points, page)
time.sleep(20)
browser.close()
</code>
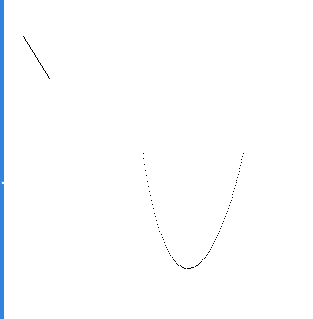
And this is the result:
[
Curves drawing
Clicking around a website
When coming to web scraping, there’s (almost) no need to implement again the Bezier curve movement, since there are already some packages, like PyClick that make the work for you.
Unfortunately, it seems that Playwright does not recognize the mouse movements and clicks made from PyClick (but let me know if I’m missing something), so if you want to use Bezier curves inside of it, you need to write a function for this.
You can find the whole code on the GitHub of The Lab, but in my basic example, I’ve found the bounding box of a locator item (in this case, of the cookie law button locator) and used its center’s coordinates as a fourth control point for the Bezier curve.
Once the mouse is there, you only need to click.
Key takeaways
Today we have seen together the concept of the Bezier curve and how it can be useful in web scraping.
At the moment I don’t have found in my experience one website that requires this kind of human mimicking but I’ve read around about some cases where it is needed.
For sure is a technique to keep in mind for when things get hard and we need all we have to scrape a website.