THE LAB #27: Scraping stock level data to estimate revenues
Excerpt
Web scraping can be useful for estimating the revenues of companies. How? By looking for any inventory level indication.
When discussing web scraping on these pages, we often mention e-commerce websites as an example of targets for testing our techniques. The reasons are multiple: e-commerce pricing data is factual and generally open to the public, so it’s perfectly compliant for being scraped. Additionally, during my working history in Re Analytics and then Databoutique.com, I’ve focused on scraping data from hundreds of e-commerces, especially in the luxury fashion industry.
Even if I’m not a so-called “fashionista”, being so industry-focused allowed me to understand better business dynamics which helped me as a scraper developer too.
The fashion industry, for example, has its own calendar, so there are some periods of the year when discounts are more relevant, and having the correct pricing data as soon as they happen is crucial. Or when there’s the assortment swap between summer and winter seasons, or vice versa, that’s the time when websites could change more frequently.
In the fashion industry, you also have multiple distribution channels for brands, like their own website, their stores, and their distributors’ websites and stores. This means that multiple actors need to communicate with each other in order to offer the final customer a good buying experience: usually, when you see a product on the brand’s website, you can choose to pick it up personally in a store, according to its current inventory levels.
And here comes the interesting part for web scrapers: since this communication happens in your browser, there are cases where this information could be extracted and used to build a great dataset with a huge potential value.
Inventory information enables new analysis
Out-of-stock analysis
Not every website works in the same way and also information available doesn’t have the same granularity everywhere.
The most common analysis that could be done on almost every website is the one about “out of stock” items.
In many cases, websites trigger your impulsivity giving you a sense of urgency, since there are “only a few/two/one” items left.
[

Supposing this information is real, scraping with a daily frequency (if not multiple times a day) the website, we can understand what’s low on stock and, when items are not scraped anymore, if it has sold out. Of course, this requires a state-of-the-art web scraping process since you cannot miss any item from the website, otherwise, you could wrongly think some items are out of stock.
While this information seems trivial, a great number of out-of-stock items, contextualized with other information on the target website, could have several meanings: a lack of capacity to forecast the demand, or also a huge and unexpected success of a particular collection. Again, here comes the industry expertise to interpret correctly data coming from web scraping. There are brands that release small capsules in order to make them go out of stock after a few days, and that’s perfectly normal, while for others it should never happen.
The power of web scraping applied to this analysis is that gives you a way to analyze brands’ and distributors’ behavior and performance and compare them from the outside, before having any official data from balance sheets.
Sales estimate
There are cases, and they are more common than you would think, where somewhere in the code or the API calls a website makes, the exact amount of items in stock available can be found. It may have a cap (as an example it can be a discrete number from one to nine and then have a threshold of ten or more) or not, but this is the best information available you can find on a website.
The reason is simple: by monitoring this discrete stock precisely enough every day, you can have a good proxy on the sales a certain website or brand makes, at least on the online channel, and correlate it to its financial results.
Again, industry expertise is crucial to understand how to read the numbers.
[

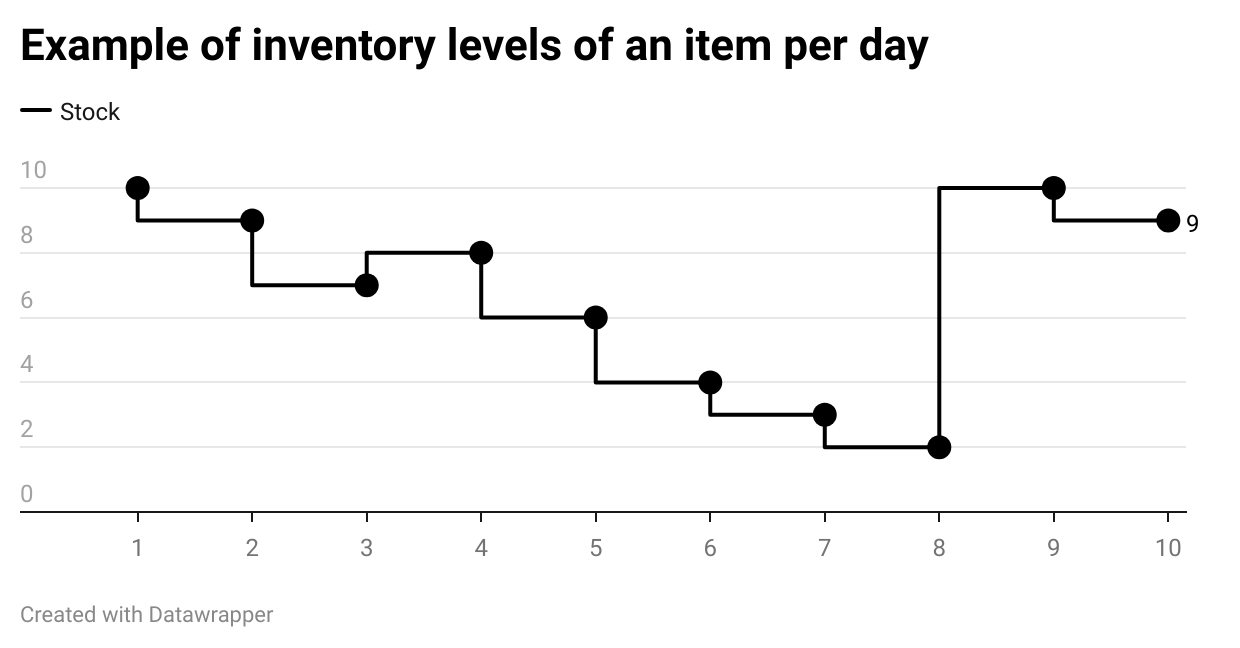
In this case, how many items you could say they are sold?
First, we need to distinguish returns from restocks: returns likely happen when a customer returns an item and, according to the volume of the sales on the target website, we can set a threshold under which a raise in quantity of item can be defined as a return. In this example, when the stock passes from seven to eight, we can label this movement as a return.
On the other hand, a restock happens when some new goods are sent to the store/website and the inventory level rises above the threshold we’ve set before, in this case when it passes from two to ten again.
The contrary happens when the fashion season ends and items should be replaced with new ones, so the inventory goes to zero but without being sold.
As you may understand, a certain set of rules and abstractions are needed to approximate the sales volume happening on a website but once you find a good fit, the value you’re extracting it’s incredible.
But how could it be possible that such a sensible value is stored in plain sight on a website?
Well, that’s a question I’ve asked myself many times and didn’t find an answer, since I’ve never been involved in web development inside a company. The only reason I see is that inside companies APIs are widely used and maybe an API intended for communicating internally with the warehouse is used also by the website to check the products’ availability. In this way, data that should have remained private is exposed to the public, and it’s more common than you think.
In the next paragraph, we’re seeing it live on two e-commerce websites of publicly traded companies. This kind of data is particularly interesting for hedge funds that want to anticipate official financial results building models on top of this data. To investigate this topic further, I suggest to following
‘s newsletter called
, as he’s an expert in this.
Lululemon
Lululemon (LULU -1.72%↓) is a sportswear apparel company, listed on Nasdaq. It has almost 655 stores around the globe and sells directly on its website.
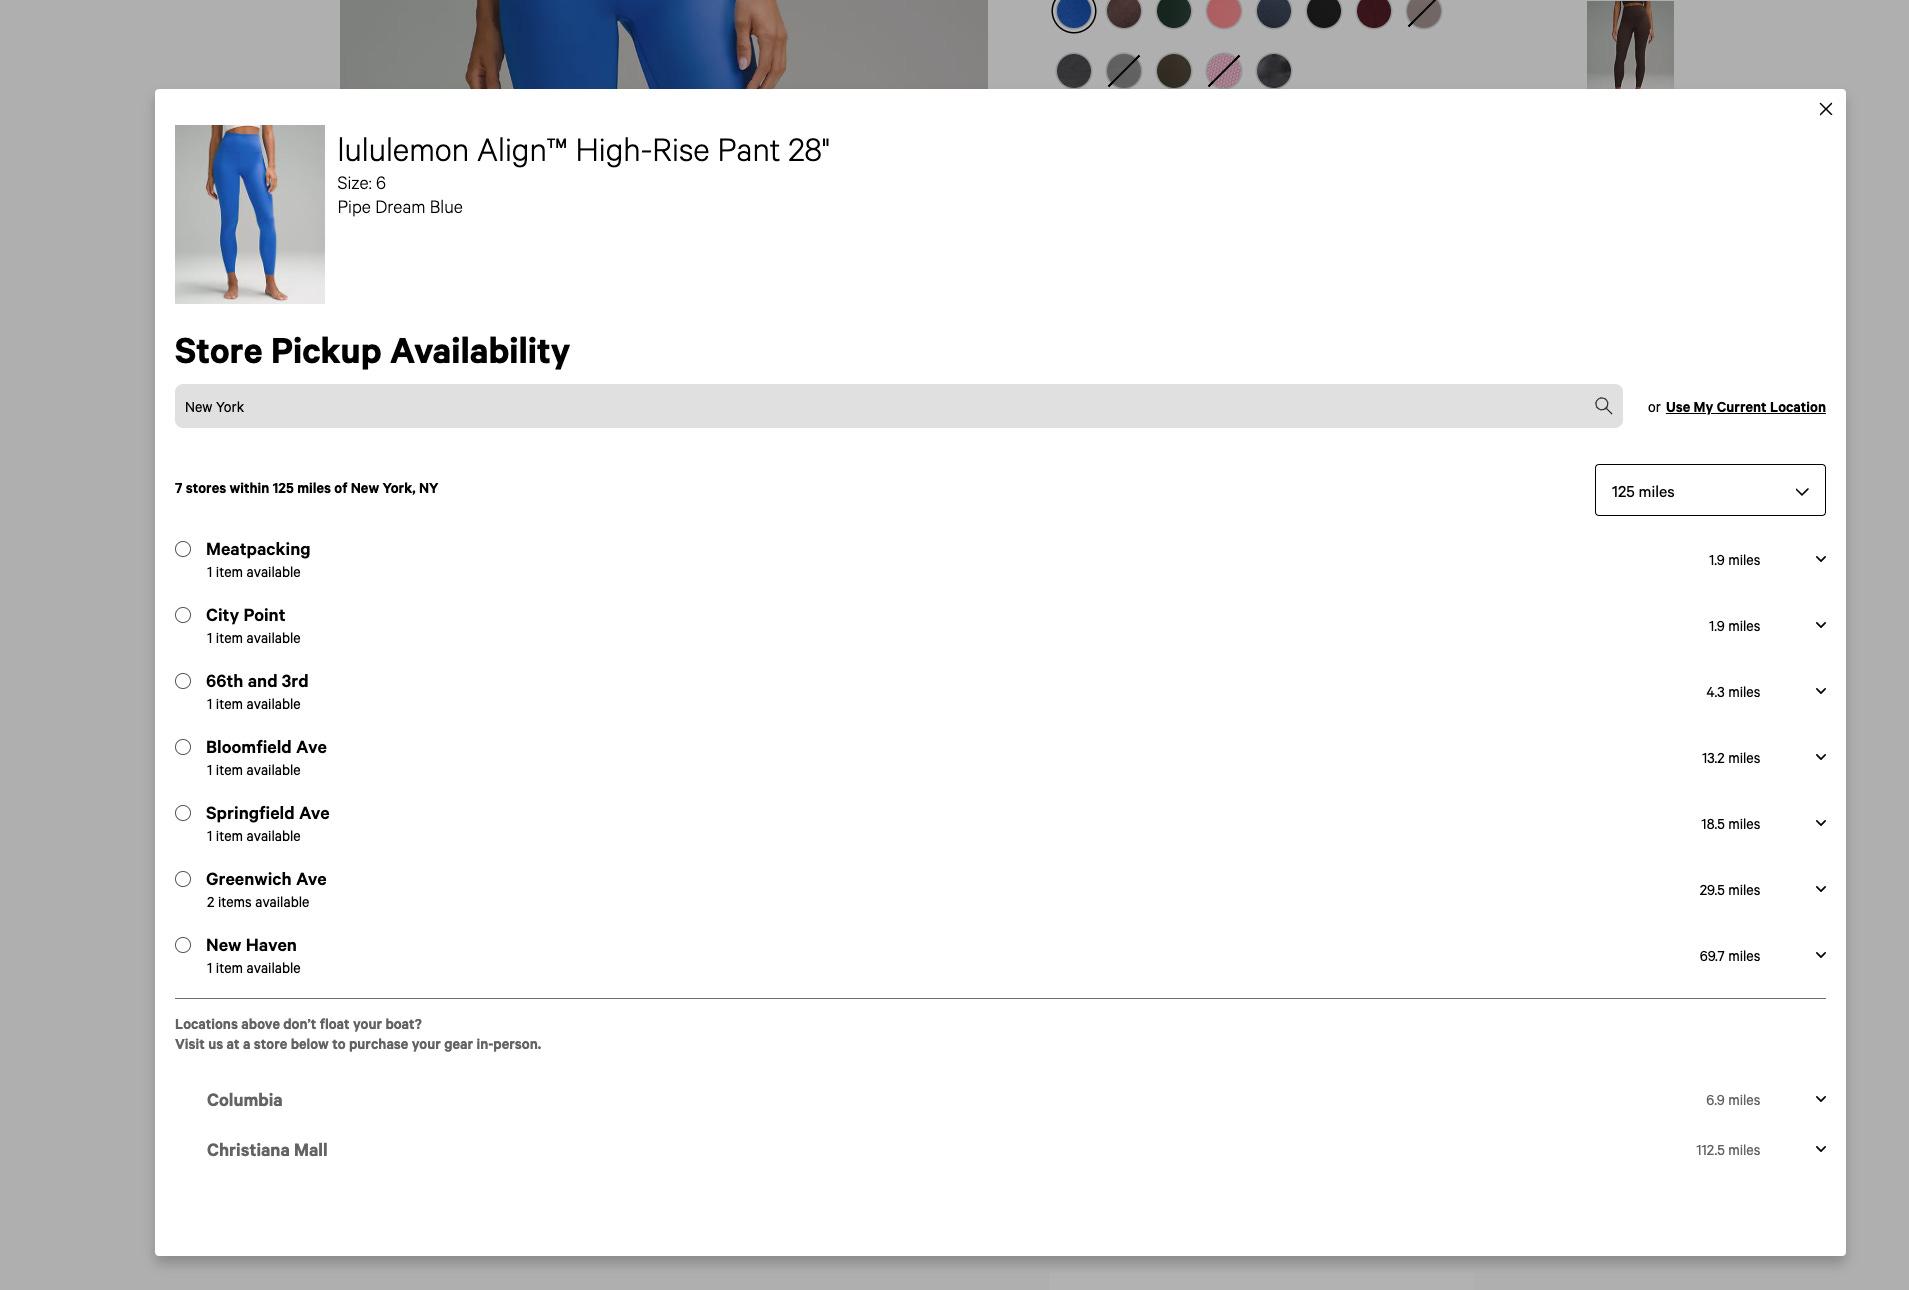
Like almost every modern retail with also physical location, it allows you to order online and pick up at the store your items. But what makes Lululemon interesting for this article is how this feature is implemented.
[

For every product, color, and size (also called SKU, stock-keeping unit), we have the exact inventory per store in a certain radius from our position.
To get this information, there’s a specific API call where, given the SKU code and the store IDs, you can obtain the correspondent inventory level.
https://shop.lululemon.com/api/inventory?country=US&skus=148302250&storeIDs=10134,10527,10130,10660,10175,10163,10160,11912,10162,10645,10197,10137,10771,10326,10192,10415,10646
So, first of all, we’ll need to get all the SKUs available on the website, and on every product page, we’ll find the list of every single color and size.
Then we need to get the list of stores, with also the country code to use in the API. Luckily, another APU call is coming to support us.
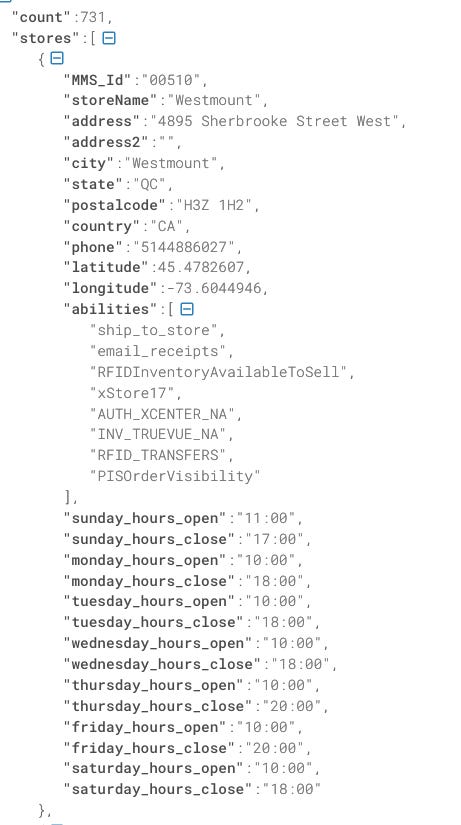
https://shop.lululemon.com/api/stores
Here’s an extract from the response:
[

We’re getting 731 stores instead of less than 655 officially declared, so maybe there are also some closed locations, warehouses, and wholesalers.
Now we’ve got all we need. Per each SKU, we can iterate on each store to get the actual levels of inventory. Doing it daily or more frequently, we can work on our revenue estimator model, based on direct-to-consumer sales, which accounted for 46% of the revenues in the fiscal year 2022.
On
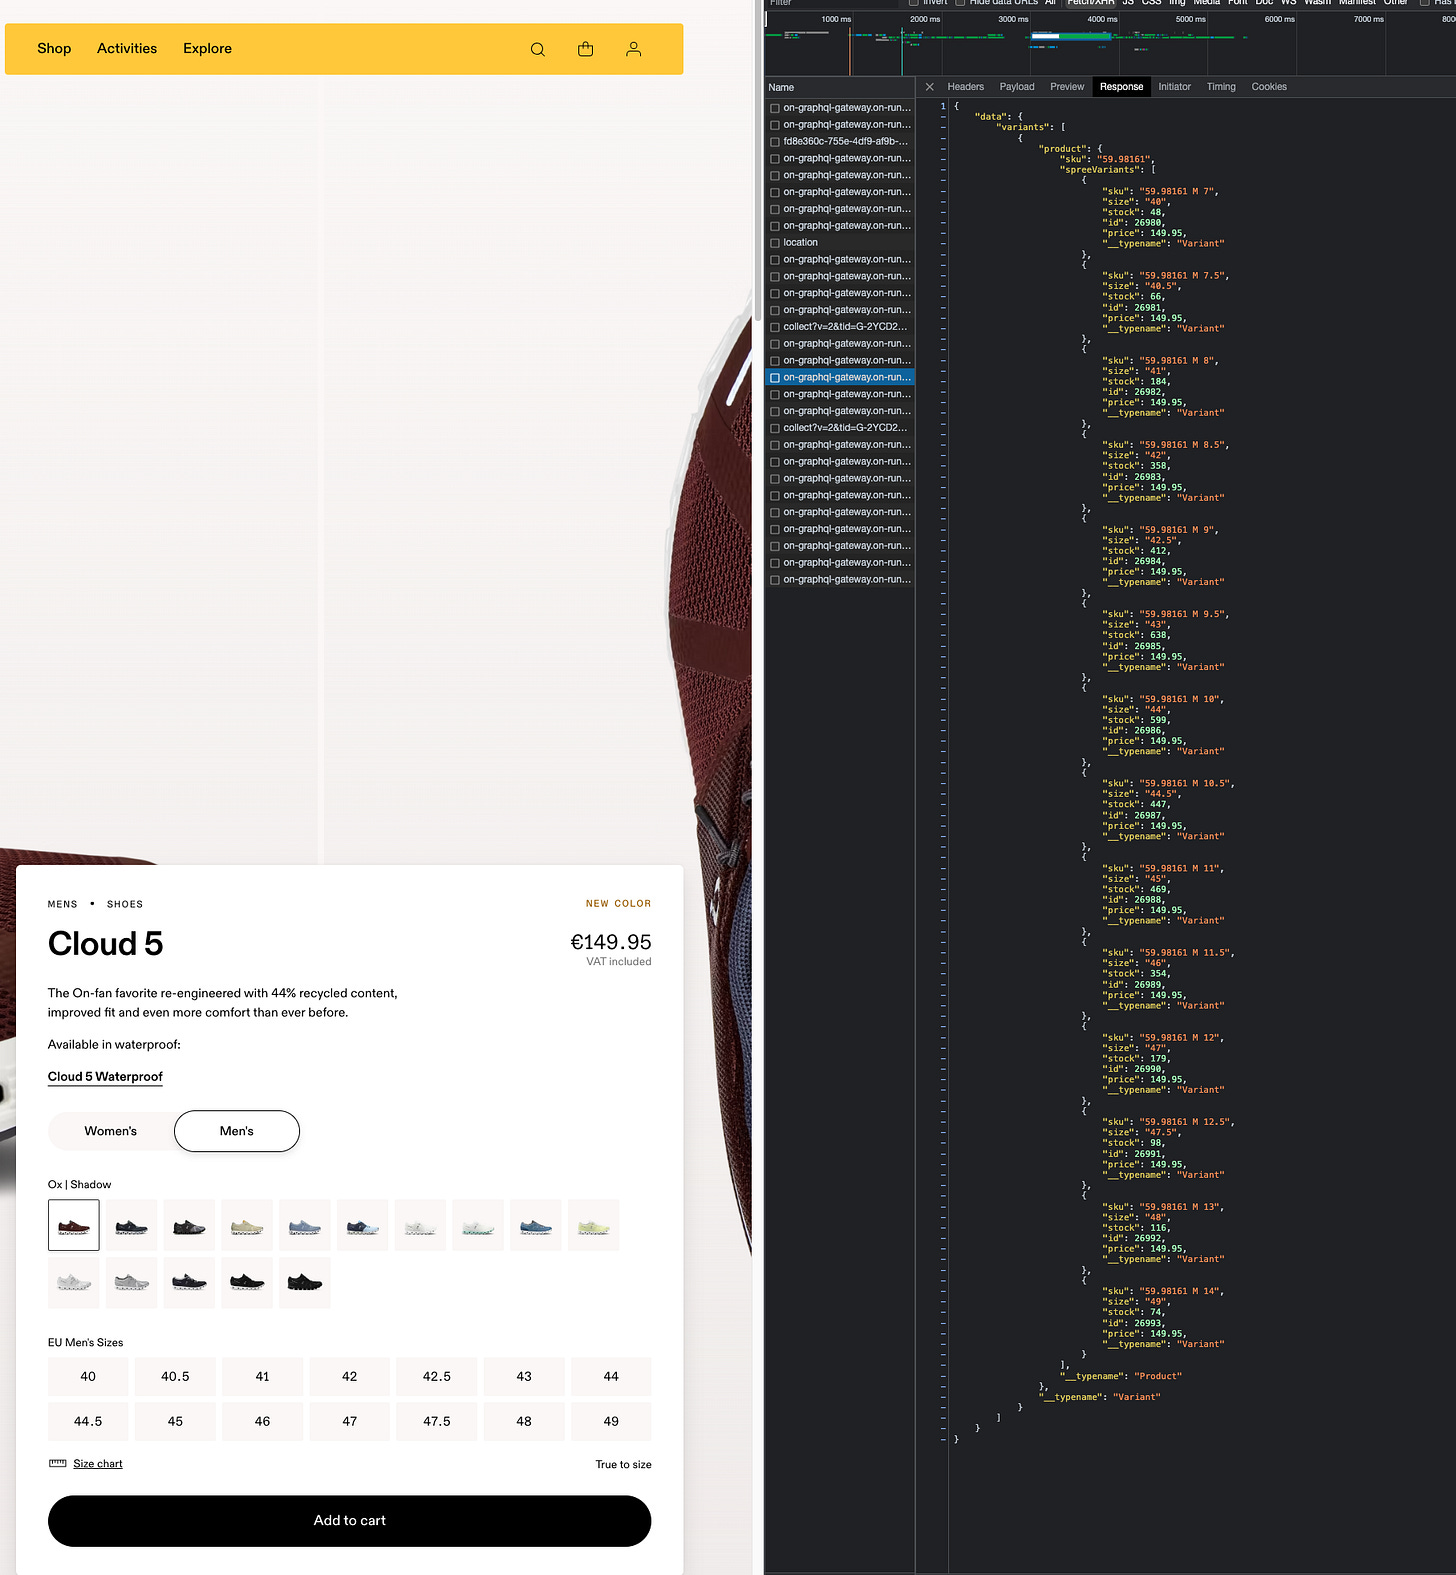
On (ONON 2.28%↑) is a European sportswear company founded by athletes in 2010 and listed to NYSE in 2021.
Exploring the website, I could not find the same level of detail we had on Lululemon, since there’s not the option to pick in store the items.
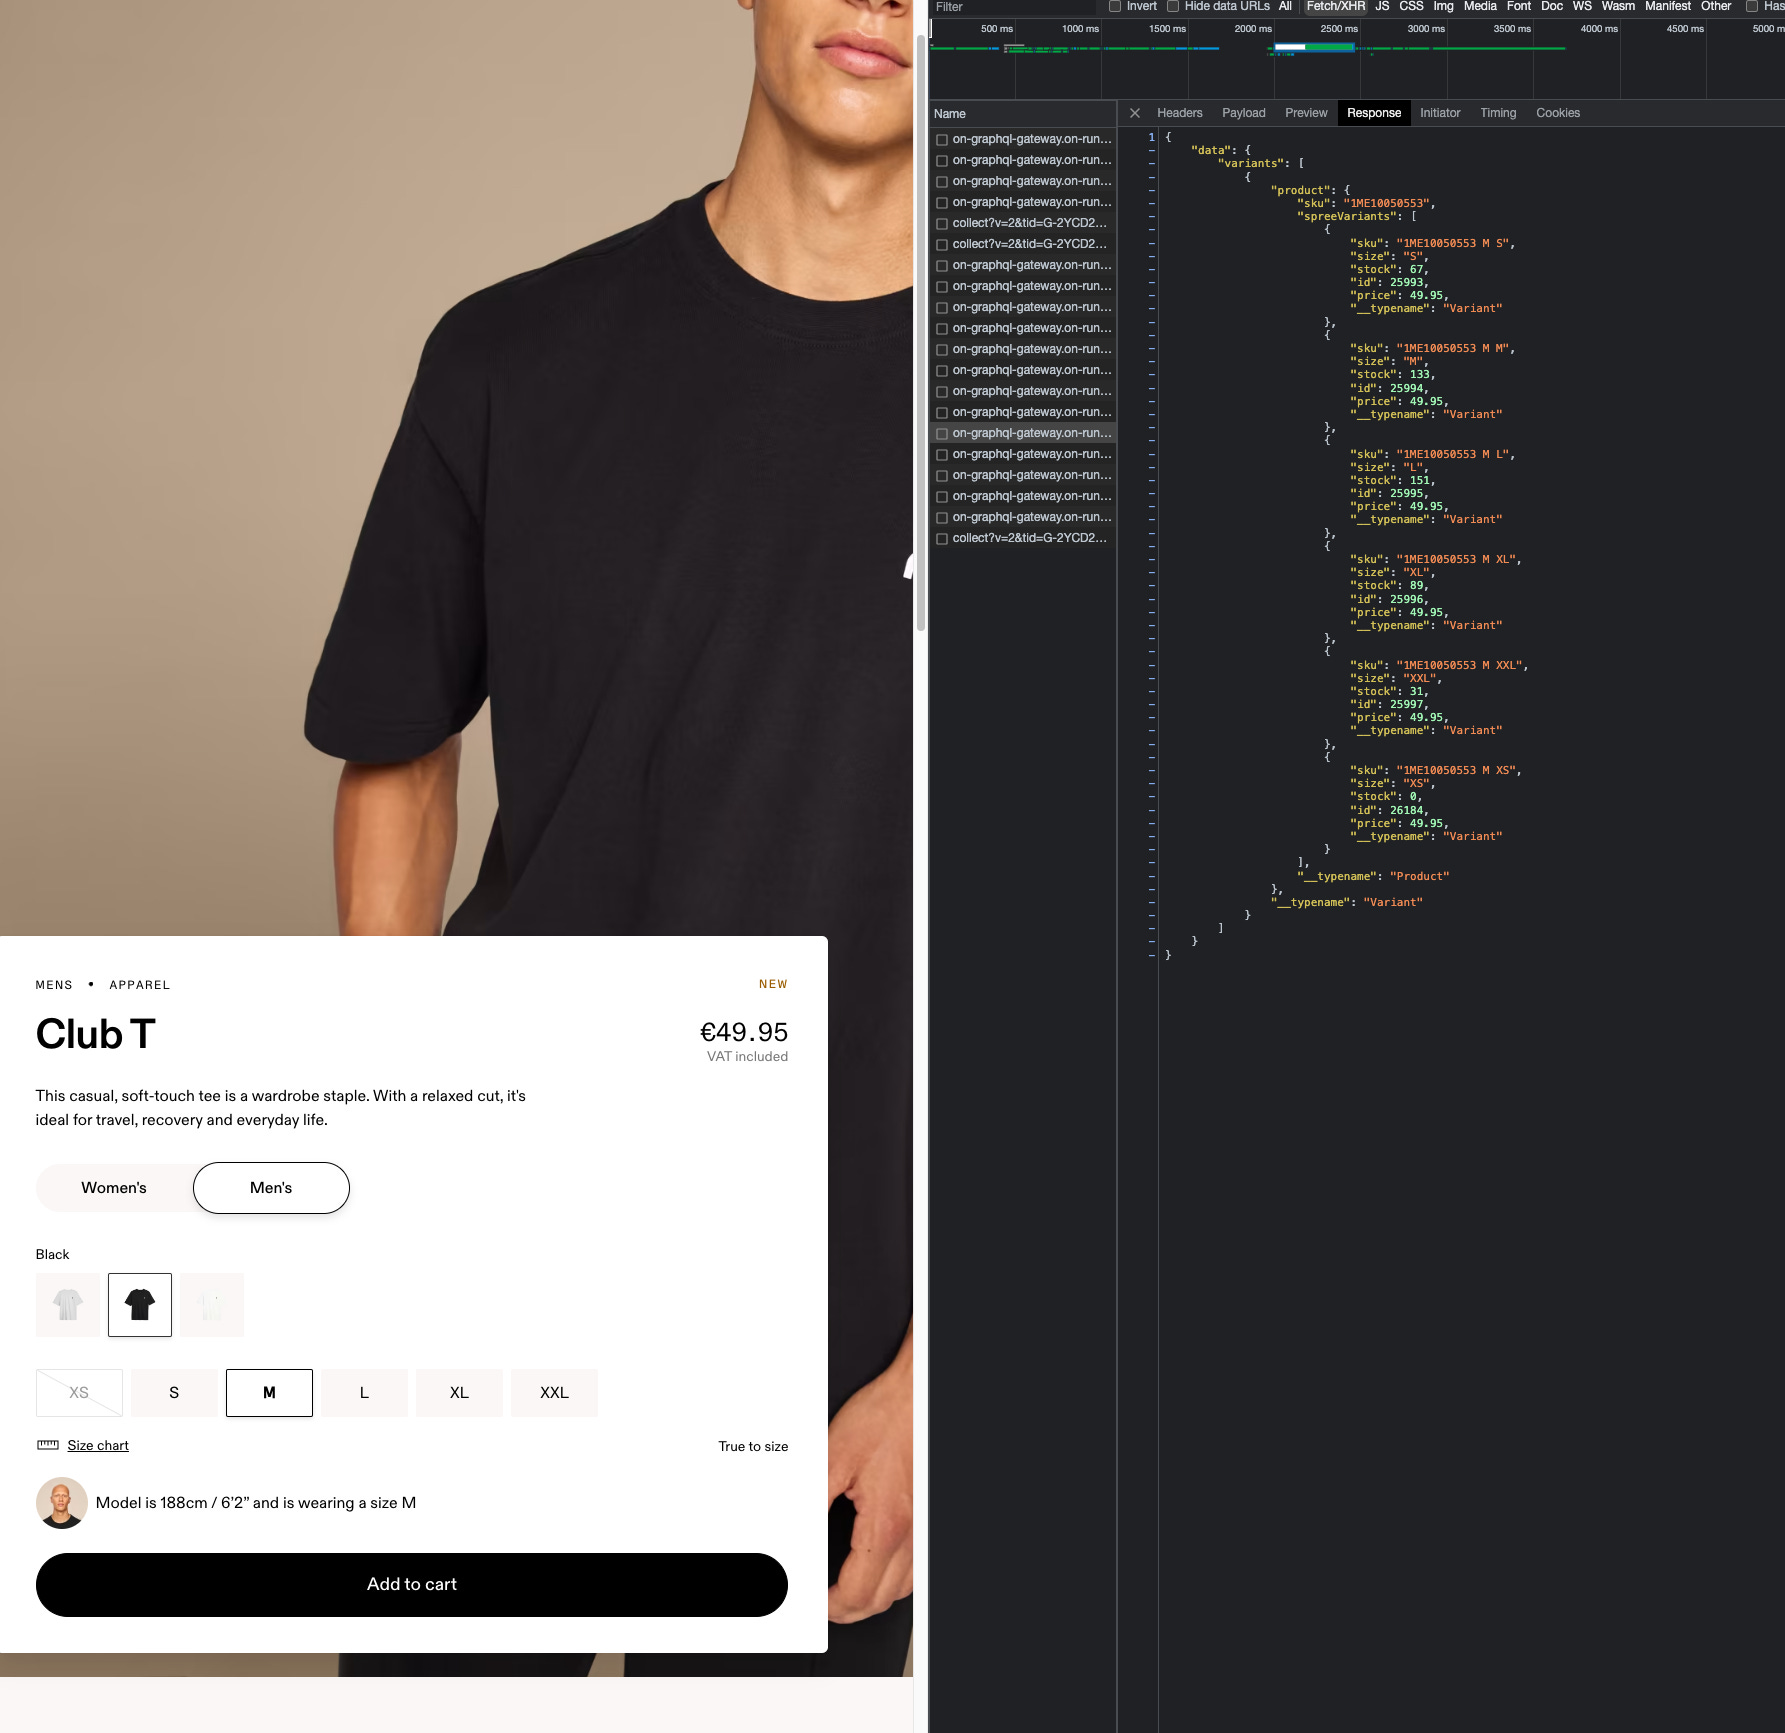
But there’s still some gold to mine on the website: let’s have a look at the API calls made when loading a product page.
[

This seems quite interesting, don’t you think?
For having such a volume of items, probably this is the inventory of a central warehouse, which serves e-commerce and maybe also a geographical area.
If we get the same data for a pair of shoes, which is the core business of the company, we get hundreds of pairs per size and color, and it’s too much for being available only for the e-commerce website.
[
As we did for Lululemon, to create our revenue estimator, we need to scrape the whole website to get all the product pages and then query the API to get all the inventory levels per SKU.
Final remarks
In my data-providing company, Re Analytics, we had the chance to scrape inventory-level data and sell it to hedge funds, so they could build their revenue estimator on top of it. Of course, this’s not the case for these two websites: in fact, building this kind of derivate dataset is valuable until only a few hedge funds have them, otherwise, the price of the stock would incorporate this information.
Today we’ve picked up some low-hanging fruit but we demonstrate once again how the web could be a gold mine of information if you know where to look at (and of course, extract it).